personal technology radar
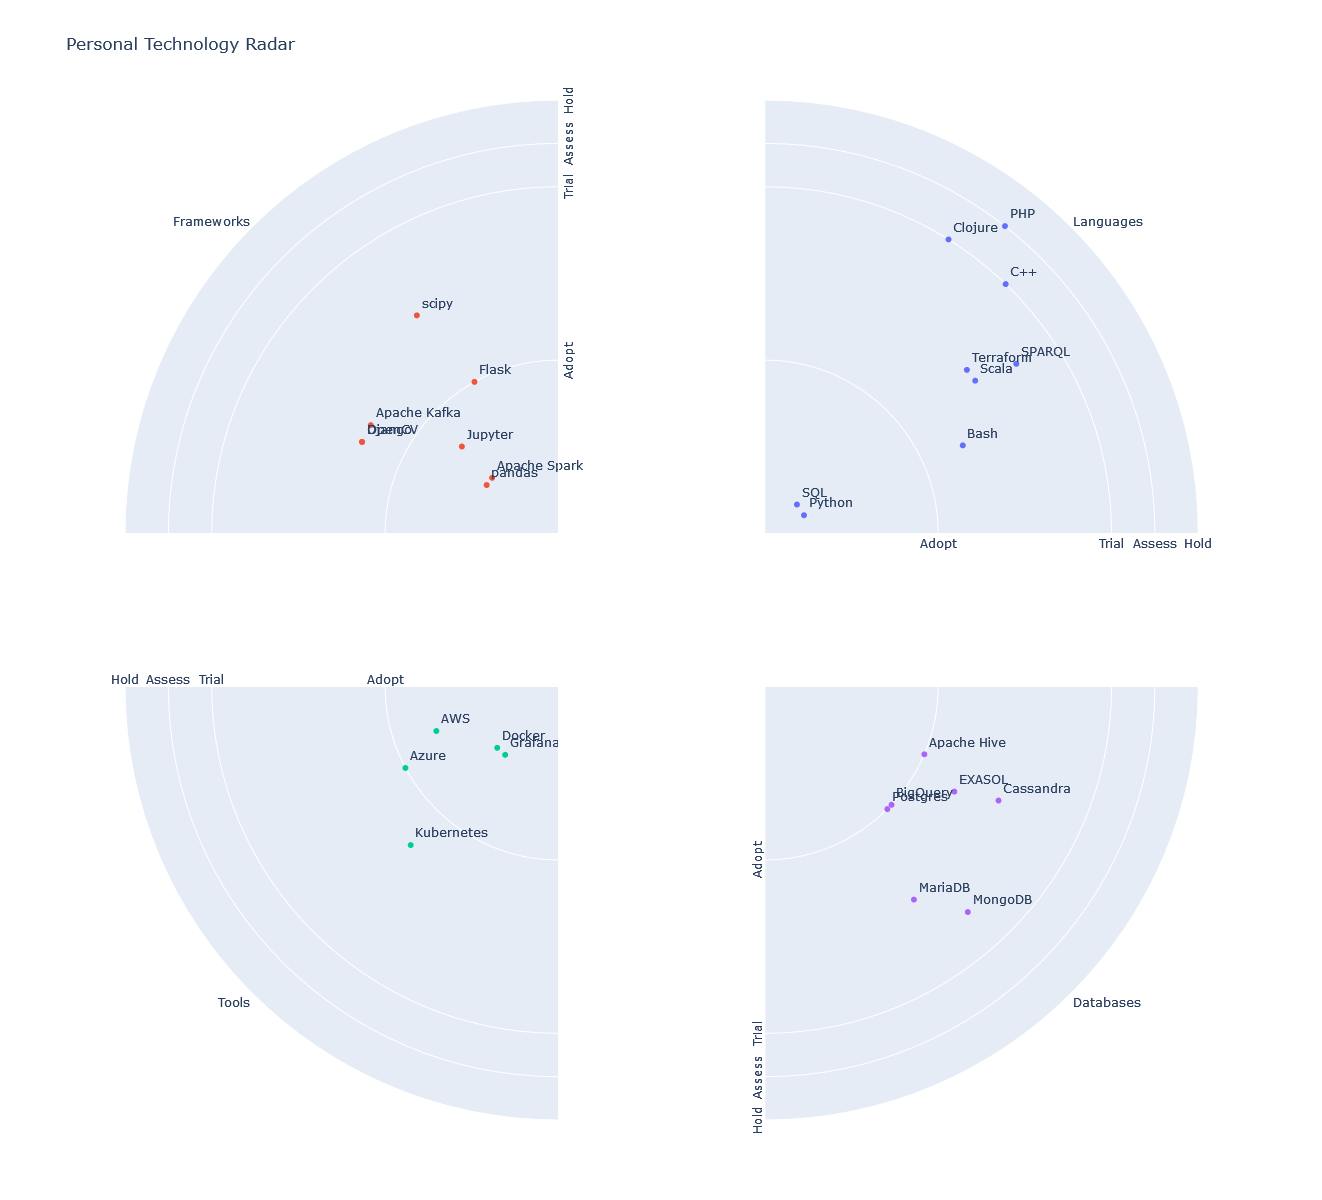
One type of data visualization I particularly enjoy is the technology radar. If you’re unfamiliar, it provides an overview of the languages, frameworks, tools, and other technologies currently in use at a company—a snapshot in time. What makes it fascinating is that it doesn’t present a simple black-and-white picture, such as merely listing the languages a company endorses or uses.
Instead, it features a plot divided into areas labeled “Adopt,” “Trial,” “Assess,” and “Hold.” Each area represents the level of adoption for a given technology within the company:
- Adopt: Well-established and used in production.
- Trial: Ready for use but not yet proven to the level of “Adopt.”
- Assess: Appears promising but isn’t ready for trial yet.
- Hold: Technologies to avoid—steer clear.
This concept got me thinking: why limit it to the company level? Wouldn’t it be great to showcase my personal experience and opinions in a similar format? Hence, I present to you the Personal Technology Radar!
Using this Jupyter Python notebook, you can easily create your own radar. Simply check out the resources/skills.ods file and populate it with your favorite and least favorite technologies. If you decide to share your radar, feel free to give me a shout!
Cheers,
Marko